|
|
|||||||||||||
|
|
|||||||||||||
|
|
|||||||||||||
|
|||||||||||||
|
Digital Fault Recorders Testing Devices Protection Relays Monitoring Devices
|
PMU Control Center Software for Synchrophasors Management compliant to IEEE C37.118 protocol
|
||||||||||||
|
|
Brochure FR947-EX/PMU with Pharos Digital fault recorder with Phasor Measurement Unit capability |
||||||||||||
PHAROS - System introduction |
|
||||||||||||
|
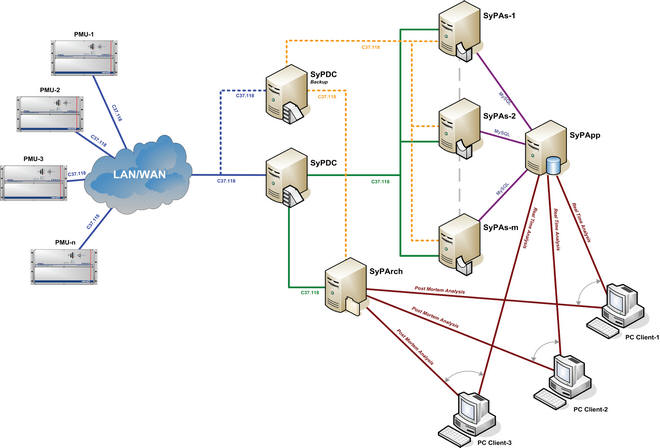
LogicLab designs and supplies a turnkey solution for PMU control centre. LogicLab implementation is based on open source software and database for powerful and cost saving solution. The PMU control centre system is designed to be scalable, reliable and easy maintainable. Standard design includes four server typologies: SyPDC (Phasor Data Concentrator), SyPAs (Phasor Data Base Access Server), SyParch (Archiving Server), SyPapp (Application Data Base Server). SyPDC collects all synchrophasors frames from connected PMU and sends synchronized frames to SyPArch, for historical storage, and to SyPAs. SyPAs manages the C37.118 frame and stores data in SyPApp data base for real time and/or post-mortem visualization. SyPDC is capable to manage up to 3000 synchrophasors and SyPApp is capable to manage up to 800 synchrophasors. System is easy scalable: each server can be replicated to improve reliability (backup) and/or improve performance and total amount of synchrophasors managed. |
|||||||||||||
PHAROS - Documentation |
|
||||||||||||
|
User Guide If the English version is not available, contact us and we will provide the document that you have requested.
To download from
the website the User Guide it is necessary to have a user name and
password.
|
|||||||||||||
PHAROS - Architecture |
|
||||||||||||
|
SyPAs is a database server powered by MySQL and it is used for real time visualization, analysis and alarm. This server, with 1 terabyte hard disk installed, is capable to manage up to 1.5 billions of synchrophasors. These capabilities and performances can be increased using larger hard disk or raid system. In a system with 20 FR947-PMU with 32 analog inputs, SyPAs server, with 1 terabyte hard disk, ensures a history of 1 day of data with a frame rate of 25 frame/s. These data are readily available to the user who can use them in Pharos for analysis and verification. In addition to SyPAs, the archiving server SyPArch, can be used to retrieve data older than the maximum time available with SyPAs; with the above example, data older than one day. In a system with 20 FR947-PMU with 32 analog inputs, SyPArch server, with 3 terabytes hard disk, ensures a history of 1 year of data with a frame rate of 25 frame/s. As happens with SyPAs, these capabilities and performances can be increased using larger hard disk or raid system. Instead of SyPAs, the recovery of data in SyPArch requires the extraction from the archive of the interesting time interval. Pharos supplies many tools for synchrophasor analysis that include alarms setup and signalization, measures trend and candlestick chart, measures visualization using different ways (direct, gauge indicator, geographical, electrical, surface chart...), phasor representation, statistical analysis, stability analysis, FFT analysis, low-frequency oscillation, dumping measurement, islanding detection. Pharos can work in three different modes: Live, Movie and Photo. Live is the Real Time visualization. All synchrophasors can be displayed with few seconds delay. Also analysis algorithms and alarms work in real time as well all tools available with Pharos. Movie and Photo are different ways to use stored data for post mortem analysis. Movie displays the stored data as happens in Live mode; it is a replay of an interesting events or fault over a selected time interval. All Pharos tools are available and user can easy analyse the grid behaviour and the alarm signalizations. Photo displays synchrophasors in static mode as happens with a recording of FR947. In this mode only chart tools are available and all data in the interval selected will be displayed immediately as a picture. Pharos is full integrated with FR947 digital fault recorder and additional features are available only with LogicLab devices. Using Pharos, it is possible to monitor the diagnostic of each device, enable pop-up message when a new recording is available for download, enable synchronization status visualization, network diagnostic and direct link to SpyFR947 with automatic connection to device . |
|||||||||||||
PHAROS - Main tools description |
|
||||||||||||
|
Alarm Chart with Thresholds This chart shows the trend of one measure per time. With the measure trend, it is also displayed the warning areas of the enabled alarms. Figure on the left side shows one minimum (red) and one maximum (green) threshold enabled. There is no limits on the number of thresholds that can be configured. User can choose the time axis width from 10 minutes to one day, performs zoom, customize chart, export waveform in several formats (xls, jpg...), calculates statistical values on measurements.
Trend measure chart This chart shows the trend of measures of the same quantity (frequency, amplitude, phase...) from different PMUs or feeders. Up to 50 different measure graphs can be plot on a single chart. A legend on the right side helps user to identify and enable/disable single graphs. User can choose the time axis width from 10 minutes to one day, performs zoom, customize chart, export waveform in several formats (xls, jpg...), calculates statistical values on measurements.
Candlestick chart This chart shows the trend of one measure per time. Candlesticks cover a selectable time interval and they are composed of the body (red and blue), and an upper and a lower shadow (wick). The bodies show the entry and exit average value; body is blue when final value is less entry value, red in the other case. Wicks shows the maximum and minimum value reached in the time interval of the body. User can use the same options available for trend measure chart.
Geographic view This tool shows, over a map, the position of each device installed. On the right side, it is possible to display the diagnostic status, the frequencies and the voltage phases. In diagnostic status mode, the icons show one of the five different status of FR947-PMU: working, out of sync, failure, not connected, maintenance. In frequency mode, it is shown the frequency and the difference with average frequency that it is shown in a chart on the bottom left corner. In phases mode, the icons show the phasor representation of voltage inputs.
Surface Chart This tool uses a graphical representation to easy identify grid faults or anomalies. User can choose to plot frequency, voltage or current measures and assign a colour representation for 9 different measures ranges. Each second, the selected measure is updated and displayed with the related range colour for each PMU. It is possible to plot the absolute value or the difference with average measure over all PMUs. This is very useful to verify if one or more PMU have different behaviour, for example during islanding or faults events.
Powers and power factor This tool shows in one chart active power P, reactive power Q, apparent power S and power factor cosφ. The display concentrates in one graph of all quantities related to power, allows the user to control the power flow of the various feeder in the monitored grid. User can choose up to 10 different feeders simultaneously. On the bottom side the actual value of each quantity is displayed in numerical format. User can choose the time axis width from 10 minutes to one day, performs zoom, customize chart, export waveform in several formats (xls, jpg...), calculates statistical values on measurements.
Stability analysis This chart uses the direct sequence to identify instability condition of the grid comparing two different substations voltage. Using the definition of phase difference, acceleration and slip frequency, it is possible to easy identify instability condition using the chart in the upper right corner, where the instability regions are highlighted. It is also possible to configure an alarm condition when the instability region is reached. Another tool supplied with Pharos is capable to monitor up to 20 different connections simultaneously.
Polar chart This tool plots multiple phases in polar representation and, on the right side, it is displayed the phase measure and the phase difference between each phase and reference signal. The reference signal can be chosen from the plotted phases and can be change at any time. This tool is very useful in Live mode because it fully exploits the potential of real-time protocol C37.118. In this way, user can easy identify all problems related to phase difference between substations, between voltage phases and between current and voltage phase.
Frequency gauge indicator This tool shows the frequency. Measures are collected by each PMU and displayed simultaneously. Multiple visualizations are available on this window: gauge indicator, to easy identify out of frequency conditions; linear indicator, to help user to evaluate the frequency measures; numerical representation, to show the real time frequency value. In this way, user can easy identify all problems related to frequency difference between substations, and easy identify dangerous situations like islanding condition.
Oscillations and damping This chart shows an FFT calculation on each measure performed by FR947-PMU. FFT chart uses the high frame rate available with C37.118 to evaluate and analyse low frequency oscillations and system damping. This capability, not available with standard SCADA system, allows user to control grid behaviour in real time and analyse faults. On the left side, will be shown all the oscillation frequencies present and the related damping factors. User can customize chart and export waveform in several formats (xls, jpg...)
Alarm setting and status It is possible to configure thresholds for each measure collected or calculated by Pharos. With threshold values, it is possible to define the comparison operator (<, >, =, ‰ , ‰¤ ‰¥. For each alarm, it is possible to define a description, 7 levels of warnings (information, low, medium-low, medium, medium-high, high, critical), delay, hysteresis, tolerance. Each alarm is configurable to be visible to all PC clients connected or only to the client that configure it.
Statistical analysis From each tool, it is possible to open a window with statistical analysis of displayed data. This window supplies information about minimum, maximum and average value, variation from average value, standard deviation and full width at half maximum (FWHM). These calculated values are displayed with two different time ranges. The first section of the table shows the quantities calculated using the same time interval selected in the main window (e.g. 10 minutes), the second section shows the quantities calculated from the starting of the services. This doubled information helps user to understand both transient and global behaviour of the grid.
|
|||||||||||||
PHAROS - Multimedia |
|
||||||||||||
|
|||||||||||||
PHAROS - Download |
|
||||||||||||
|
If the English version is not available, contact us and we will provide the software that you have requested.
To download
from the website it is necessary to have a user name and password. |
|||||||||||||
|
|
|||||||||||||
|
© LogicLab s.r.l. - VAT 13218590159 - Via della valle 67 - 20841 Carate Brianza (MB) - Italy - Tel (+39) 0362.805287 - Fax (+39) 0362.1914102 - info@logiclab.it |
|||||||||||||
|
|
||||||||||||